The dashboard you need to track your agency’s financial performance
Updated 15th July 2025 – by Paul Muggeridge-Breene, Thrive CEO
What was your agency’s real financial performance last month?
I’m not talking about cashflow, important as that is. I mean what was the value of the work actually carried out during the month, and how much of that was left after all outgoings?
Understanding financial performance is the first step towards really feeling in control of your agency’s finances. And it’s the only way to feel confident in making the dozens of decisions you face every day when running an agency.
Here’s how to make a simple financial dashboard that will show you at a glance how your business is performing.
1. Build the framework
Start with a blank spreadsheet, either in Excel or Google Sheets. If you use Excel, make sure it’s a live version so that you only ever have a single dashboard (rather than multiple copies flying around with different version numbers etc).
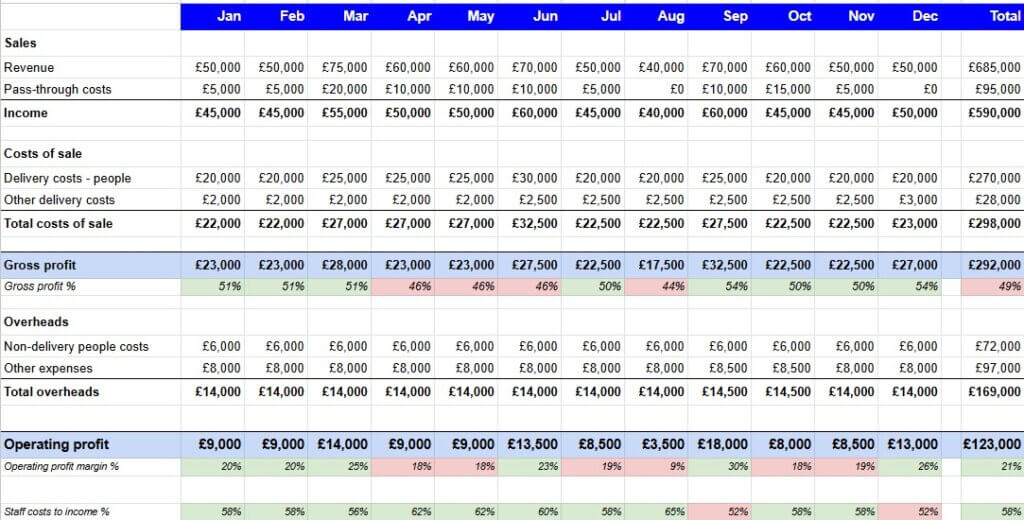
In the first column, list the key categories:
- Sales:
- Revenue
- Pass-through costs
- Income
- Costs of sale:
- Delivery costs – people
- Other delivery costs
- Total costs of sale
- Gross profit
- Overheads:
- Non-delivery people costs
- Other expenses
- Total overheads
- Operating profit
Then enter the month names for your financial year across the top row, and add a “Total” column header at the end.
2. Enter the formulas
Now enter simple formulas to do the calculations required:
- The “income” row should be revenue minus pass-through costs,
- The “”total costs of sale” row should be “delivery costs – people” plus “other costs of sale”
- The “gross profit” row should be “income” minus “total costs of sale”
- The “total overheads” row should be “non-delivery people costs” plus “other expenses”
- The “operating profit” row should be “gross profit” minus “total overheads”
So, for example, assuming you’ve started your categories in row 2 and your first month is in column B, the formula for income in your first month would be “=B3-B4”. Then you can drag the cell across the rest of the row to copy the equivalent formula into the rest of the months.
3. Enter the data
Now you need to get your financial data into the spreadsheet. There are lots of ways of doing this, with some being more complicated than others.
The simplest way is to just gather the data and manually enter it. You could potentially take it from your accounting system, or whatever system you currently use to manage your finances. But there’s a big caveat here. You need to enter figures relating to the actual work that was carried out during each month.
Your accounting system almost certainly shows figures based on the value of the invoices that were sent and received during each month. These figures are unlikely to be the same as the value of the work you did, or the value of the outgoings associated with that work (although they might be if your work is made up of 100% retainers / repeating monthly contracts).
One way of calculating the “actual work” figures is by taking each piece of confirmed work you have and splitting the revenue evenly across the period it runs for. Eg a £60k project running from March to May would be £20k for March, £20k for April and £20k for May. Then do the same thing for any associated costs – eg pass-through costs etc. Note that pass-through costs are anything you’re charging as part of a job that you are paying straight to a third party – eg for social media advertising.
The “cost of sale” section should include all costs directly related to the delivery of client work. These will largely be people-related – i.e. employees and contractors – but there may be other costs to include, eg a software license that is explicitly related to a client project.
Any people costs that aren’t related to delivery – eg management and admin staff, or a portion of the CEO / founder’s costs to cover sales and new business activities – should be captured in the “overheads” section, along with all other expenses (eg rent, travel, subscriptions etc). These can generally be entered based on when they’re paid, if they’re mostly monthly recurring bills. If you have a big one-off cost that covers multiple months (eg an annual insurance bill) it might be better to spread it across the relevant period.
A key point to note is that VAT shouldn’t be included in any of the figures in your dashboard, as it’s irrelevant from a business performance perspective – you’re just passing it on to HMRC. So, all revenue, costs and expenses figures should be VAT-exclusive.
4. Add some key metrics
Now that your dashboard is beginning to take shape, you want to add some key metrics that will help you understand the performance of your agency.
- Gross profit margin: Calculated as your gross profit divided by income (not revenue), presented as a %
- Operating profit margin: Calculated as your operating profit divided by income, presented as a %
- Staff costs to income ratio, calculated as total staff costs divided by income, presented as a %
You can enter formulas for these metrics in new rows in your dashboard. Don’t forget to format the cells as percentages.
The advantage of using metrics like these is that they’re often easier to interpret at a glance than the bald numbers. Generally, you want to be aiming for a 50% gross profit margin, a 20% operating profit margin and between 55-65% staff costs to income ratio (all after you’ve been paid at a market rate).
As ever, there can be nuances involved here, and metrics are only ever designed to guide you and help with decision-making, not to make the decisions for you!
And that’s your dashboard complete. It’s simple, and deliberately so, as you want it to be understandable at a glance. The complex part can actually be getting the right numbers into it. But that’s more than worth the effort involved, because of the crystal clear view of your agency performance it provides.
Our software tool, Pulse – the Agency Management Dashboard, has been designed specifically for agencies, to provide founders with confidence and clarity, and to help make key business decisions.
Paul Muggeridge-Breene is an exited agency founder, qualified accountant, certified coach, former international journalist and a member of the British Psychological Society. Please get in touch if you’d like to discuss how Thrive can help you.